If your goal is to save for retirement, a work-optional lifestyle, or a second career, asset location and asset allocation are two key concepts that can help shape your financial planning. Read on to explore some practical considerations.
Learning Points
Learning Objective
Most long-term investors like you are seeking a sense of security when you create a financial plan. While peace of mind is relative for each of us, you believe it is achievable through thoughtful dialogue and planning.
You know to focus on what you can control, and to pair your long-term goals with a personalized, long-term investment strategy.
You want to improve your knowledge of your personal financial situation. You want to know how you are progressing toward your goals. Goals like saving for retirement or a career shift.
A financial planner can help you work towards these meaningful goals. They can also provide accountability and personalized education for your financial life.
If you’re looking to learn more about how asset location and asset allocation can provide a tax-efficient framework, read on.
A Starting Point: Which IRA Can I Contribute to in 2024?
Your income, tax filing status, and whether you have access to a workplace retirement plan determine your IRA contribution eligibility.
For investors who i) choose the married filing jointly tax election and ii) are covered by a workplace retirement plan, the following chart illustrates which IRAs you can contribute to in 2024 based on your income.
Think of the chart below as an empty glass. As you pour more income into it, the fewer account type choices you have available at the top of the glass. For example, after you reach a MAGI greater than $240,000, your IRA contributions are limited to non-deductible IRAs.

You’ll notice that the chart above shows the income ranges where specific account types and tax treatments gradually become less available. These are the “phase-out” ranges. If your income is in a phase-out range, the amount you can contribute decreases from the standard amount based on an IRS formula.
At the top of the chart, there are no maximum income limitations for non-deductible IRA contributions in 2024. To be clear, you do need to meet the earned income requirements. Alternatively, you can choose to invest in a taxable account.
Traditional IRA: Income Limit Details
You can deduct your contributions to your traditional IRAs from your taxable income, and potentially lower your tax bill, provided you meet certain eligibility criteria.
Covered by a Workplace Retirement Plan?
Specifically, if you are covered by a workplace retirement plan, like a 401(k), your modified adjusted gross income (MAGI) affects the amount of your deduction.
Specifically, the deductibility of your traditional IRA contribution is limited by the following income phase-outs:
- For single and head of household taxpayers, the adjusted gross income phase out is between $77,000 and $87,000.
- For married couples filing jointly, the adjusted gross income phase-out range is between $123,000 and $143,000.
Not Covered by a Workplace Retirement Plan?
If you are not covered by a workplace retirement plan, like a 401(k), but your spouse is, the deductibility of your traditional IRA contribution is limited by the following income phase-out in 2024:
- For married couples filing jointly, the modified AGI phase-out range is between $230,000 and $240,000.
Roth IRA: Contribution Limit Details
If your MAGI is below the lower limit of the phase-out range for your filing status, then you meet the eligibility criteria to fully deduct your traditional IRA contribution.
For Roth IRA investors in 2024 there are modified adjusted gross income (MAGI) phase-out ranges for taxpayers making contributions to a Roth IRA.
- For single and head of household taxpayers, the income phase out is between $146,000 and $161,000.
- For married couples filing jointly, the income phase-out range is between $230,000 and $240,000.
While income limitations are a necessary reference point, they are just one piece of the puzzle to consider.
Need more details about traditional and Roth IRAs to compare against your personal situation? Here are two more educational posts to refresh your understanding of traditional IRAs or a Roth IRAs.
Account Taxability: Why it Matters to You
To accurately compare investments, long-term investors like you want to evaluate investments on an after-tax basis.
When you’re saving for a goal like retirement, understanding your after-tax numbers helps you answer the question of, “how much do I have left to spend, after I’ve paid taxes on the money I distribute from my account?”. You can’t spend risk, return, or diversification. You can’t place a downpayment using standard deviation, correlations, or asset allocation.
These investment concepts and calculations matter and it can help to have a good handle on them. Some investors truly enjoy understanding, reviewing, and adjusting their portfolios over time.
For other folks, you’d rather delegate this area of your life. And instead, focus on what gives you energy. To tackle the things that you’re passionate about. To create experiences and be with the people in your life who really matter.
Account Taxability: A Hypothetical Illustration
First, as a reminder, your traditional IRA contributions are not taxed, but your distributions are taxed. And, your Roth IRA contributions are taxed, but your qualified distributions are not taxed.
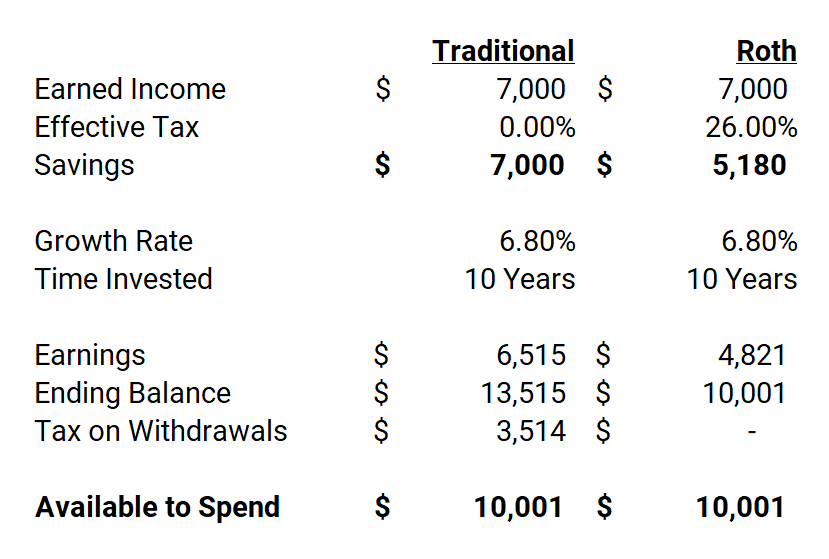
The hypothetical illustration below showing the lifecycle of IRA contributions highlights this taxation concept. Keep in mind, this example is intended to highlight how the different variables must stay constant over an unrealistic period of time for a traditional IRA and Roth IRA to maintain after-tax parity.
Specifically, the simplified IRA comparison below keeps the average effective tax rate, annually compounded growth rate, and holding period constant.

Visualizing IRA Taxability: When Does the Tax Event Occur?
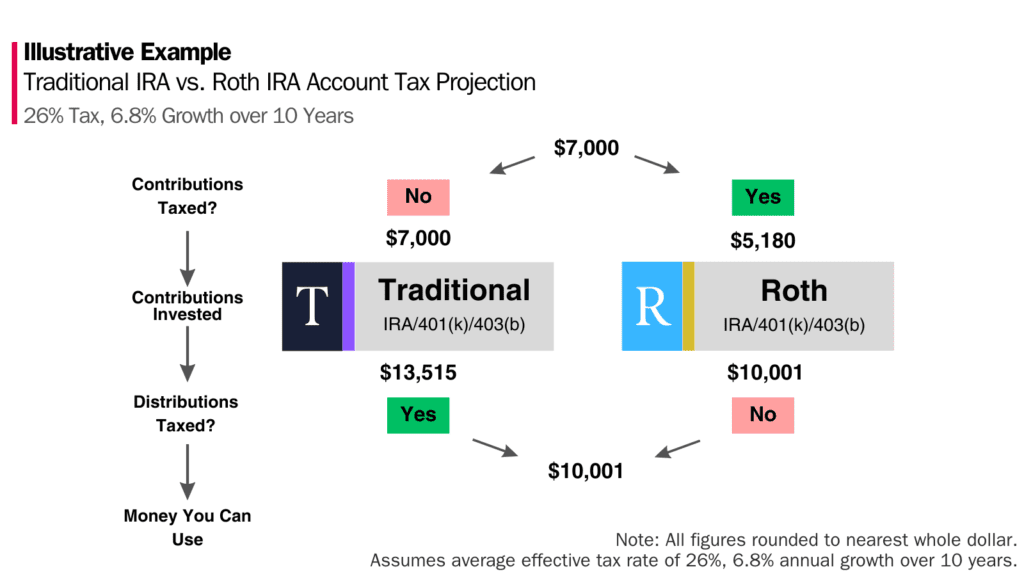
For the non-Excel audience, the illustrative example below uses the same figures as the table above:

In this illustrative example, you contribute $7,000 (a maximum contribution amount depending on your MAGI) to either a traditional IRA or Roth IRA (not both!). For the Roth IRA contribution, if you made $7,000, you’d need to pay taxes on that income. The contribution then compounds over time. Next, when you spend the resulting contribution and earnings, the qualified distribution is taxed when it comes out of the traditional IRA, but not the Roth IRA.
This illustrative example highlights that the same income, contributed to either of these account types, invested over time, and then distributed, hypothetically results in the same spendable amount of money.
Again, we’re looking to isolate the effects of the account taxability, and therefore, need to control all the other variables in this hypothetical illustration. So, why bother creating this lab experiment?
Four Quick Takeaways from the Hypothetical Illustration
- If your marginal tax rate is likely to increase in the future, contributing to a Roth account now could help save you taxes over a lifetime.
- The opposite is true for traditional IRAs. If you believe your marginal tax rate will decrease in the future, contributing to a traditional IRA could be the next savings priority for you.
- Are you trying to fund your accounts up to the maximum contribution limits each year? This can be more important to investors with longer time horizons – through the beauty of compounding – than investors who are at or nearing distribution events.
- Managing your future marginal tax bracket is worthwhile because we cannot control how the government will adjust taxes in the future. This means you maintain the ability to distribute money out of different account types. This potentially allows you to manage your marginal tax bracket.
It can be tempting to look at this concept from a short-term perspective. To simply maximize your tax avoidance in the current year. For most long-term investors, you want to look at how your decision cascades over your lifetime. It’s not a perfect science – a lot of the variables can and will change – but you can only know what you know “today” when make your decisions.
Once you’ve figured out which account(s) you are eligible to use and fit your needs, you can then determine what you should invest in.
In short, you can then decide on your asset allocation and asset location.
When long-term investors like you think about your asset location and asset allocation decisions at the same time – and the contemporaneous decision is key – you can create a cohesive view of your entire portfolio.
Asset Location
Asset location is a foundational concept at the intersection of financial planning and investment management.
Specifically, asset location describes a tax-avoidance strategy that primarily considers how the government taxes investments differently depending on three main factors:
- the type of account you contribute to.
- the type of investment / an investment’s expected return.
- how long you hold the investment.
The following is by no means an exhaustive discussion. There is academic and practitioner research that contributes to our current understanding of asset location, and limitations. In particular, research conducted by Dr. William Reichenstein, Ph. D., CFA, as well as Robert Dammon, Chester Spatt, and Harold Zhang over the past 20+ years.
The rest of this article is intended to highlight the primary factors driving asset location and its intersection with asset allocation decisions.

Why Account Types Matter
Each of these account types has specific rules governing how and when you can (or must) distribute money from them. There are three main account types to consider:
- Taxable: Brokerage accounts and joint accounts. There are no tax-deductible contributions or tax-free distributions. Depending on your holding period, short or long-term capital gain rates apply.
- Tax-deferred: Traditional 401(k)s, traditional IRAs, SEP IRAs, and SIMPLE IRAs. We discussed the taxability of traditional accounts earlier in this post.
- Tax-free/Tax-exempt: Roth IRAs, Roth 401(k)s, and Roth 403(b)s. We discussed the taxability of Roth accounts earlier in this post.
In the context of asset location, Health Savings Accounts (HSAs) and 529 accounts are purposefully missing from the list above. HSAs are unique; eligible contributions, earnings, and distributions for eligible medical expenses are tax-free. Similarly, 529 accounts are the other unique type of account that generally sits outside of the asset location decision.
Both HSAs and 529s have specific, albeit different, goals they are designed to fund. In the current tax environment, there is far less opportunity to evaluate location decisions if you have specific goals tied to these account types.
Taxes on Investments
Long-term investors like you want to efficiently navigate taxes on your investments, including taxes like:
- Dividends: Ordinary Income
- Short-term Capital Gains (STCG): Ordinary Income
- Net Investment Income Tax (NIIT): 3.8%
- IRMAA Premiums: amount varies according to your MAGI + filing status
- Long-Term Capital Gains (LTCG): 0%, 15%, or 20%
- Qualified Dividends (QD): 0% ,15%, or 20%
Depending on your account type, the effectiveness of long-term asset location decisions will depend on your specific facts and circumstances; how long you practice asset location, your tax bracket, as well as the amount of assets.
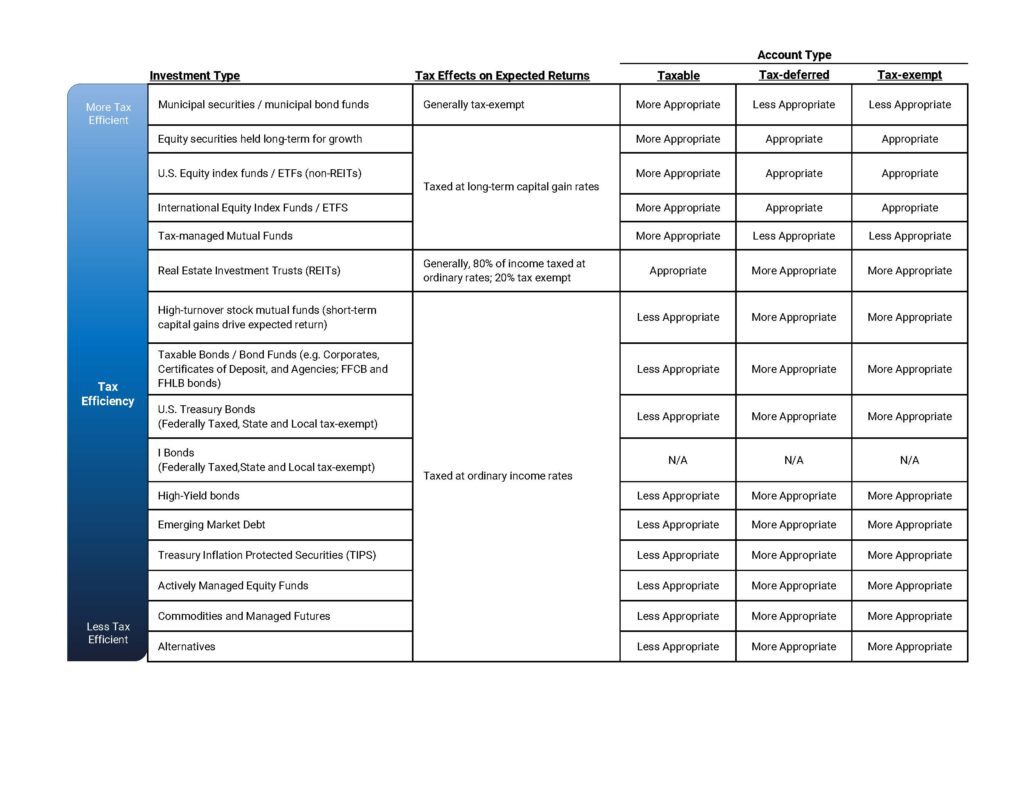
Below is a table showing how taxes affect investments held in a particular account type for a long-term investor:

Underlying these account taxability figures are the assumptions that:
- Realized equity gains are taxed at current long-term capital gains rates.
- Bond income – either individual or held in funds – is taxed at ordinary income rates.
Preferential tax treatment in the form of long-term capital gains and qualified dividends provides an increasing benefit to investors with longer investment time horizons, than shorter ones. Thus, locating higher risk/return assets like equities, rather than lower risk/return assets like fixed income holdings, in taxable accounts, can create a more tax-efficient location strategy.
Asset Allocation
Asset allocation is how you distribute your savings among investment like stocks, bonds, and cash equivalents. In doing so, you seek risk-adjusted returns based on your financial goals, time horizon, risk tolerance, and risk capacity.
Embedded within the asset allocation decision are your expected returns and risk decisions. Expected return is an estimate of the average return that an investment or portfolio of investments should generate over a certain time horizon. Riskier assets command a higher expected return to compensate for the additional risk they represent. This is called the risk premium.
The expected return represents a long-term weighted average of historical returns, considering both systematic (market-wide) and unsystematic (specific to a company, industry, or asset class).
Risk, in this context, is measured by standard deviation.
Expected return parameters often change. Tax rates, which can change with the political environment, are also rarely a constant through an investor’s lifetime. Other factors, like your income level and investment holding period(s), are specific to you, and inform your overall asset allocation decision. As new data becomes available and other factors change, your asset location decisions will shift and evolve with those factors.
For some investors, asset location might not matter as much, particularly those with relatively shorter time horizons or who are in lower tax brackets.
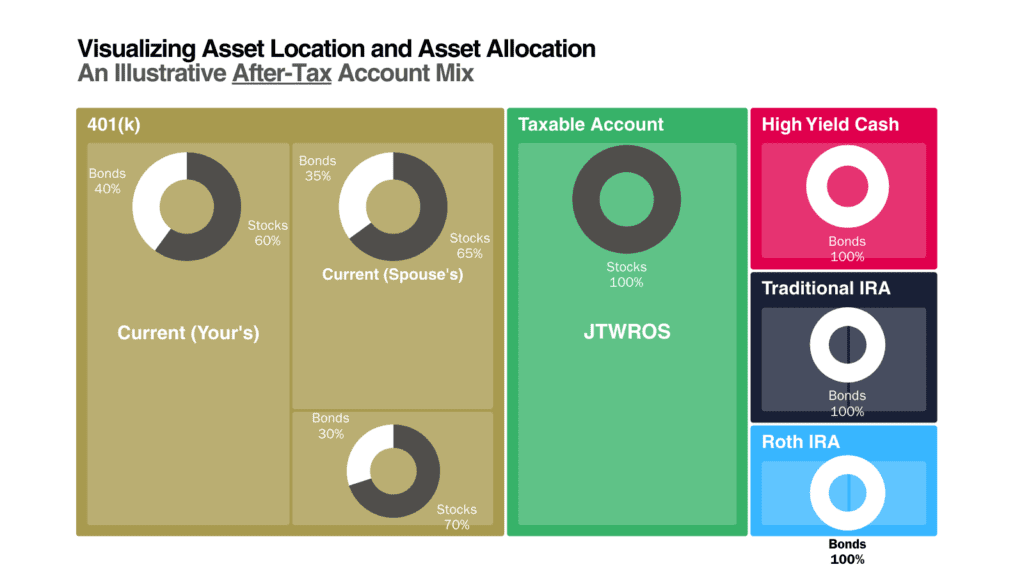
The ‘Illustrative After-Tax Account Mix’ chart below visualizes how an asset allocation might look for a hypothetical long-term investor using asset location.

Investment Type: Expected Returns and the Continuum of Tax-Efficiency
And so, different types of investments, which have different expected returns are taxed differently. Each investor’s specific situation will dictate how to implement the concept of asset location. The amount of time your investment can compound tax-free will also guide you on which types of investments you want to hold in a particular account type.
Assets with higher expected returns (and risk/volatility) are more appropriate to be placed in certain accounts than others. The same is true for ordinary income producing assets.
The table below illustrates the tax effects of different types of investments, and the relative appropriateness of that investment in a particular type of account. Again, this is not meant to be a universal rule for all investors for all the reasons discussed in this article.
Instead, use it has a framework for thinking through the appropriateness of the investment in your specific situation, particularly your own tax situation.

Summary
Hopefully, you found this helpful in understanding the concept of asset location and asset allocation.
Now that you’ve reviewed some key considerations for asset location and asset allocation, consider how it fits into your personal situation.
In a future post, we’ll explore some basic quantitative examples using after-tax figures illustrating how asset location can influence asset allocation decisions.
What works well for one person might not be the perfect fit for you. Fully incorporating all the moving parts of your financial life into your decision is a must. Make sure you understand the tax implications of investing and consider whether to consult a qualified tax professional.
Disclosure
This commentary is provided for educational and informational purposes only and should not be construed as investment, tax, or legal advice. The information contained herein has been obtained from sources deemed reliable but is not guaranteed and may become outdated or otherwise superseded without notice. Investors are advised to consult with their investment professional about their specific financial needs and goals before making any investment decision.


